[9]:
%matplotlib inline
import matplotlib.pyplot as plt
import numpy as np
import sympy as sy
import ipywidgets as widgets
from ipywidgets import interact
[10]:
x = np.linspace(-2, 2, 1000)
[11]:
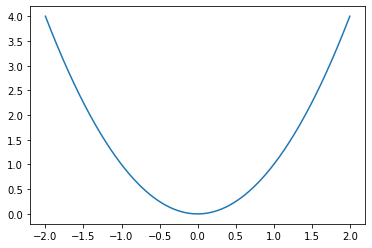
def f(x):
    return x**2
[12]:
plt.plot(x, f(x))
[12]:
[<matplotlib.lines.Line2D at 0x7fa7f86a5a50>]
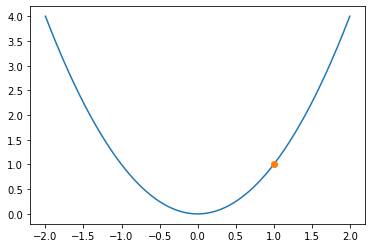
[13]:
plt.plot(x, f(x))
plt.plot(1, f(1), 'o')
[13]:
[<matplotlib.lines.Line2D at 0x7fa7f86e2090>]
[14]:
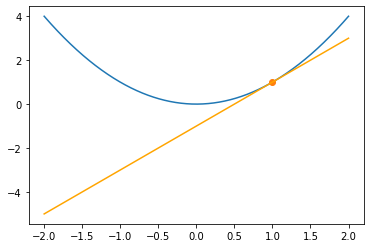
def tan_line(x, a):
    return derivative(a)*(x - a) + f(a)

def normal_line(x, a):
    return -1/derivative(a)*(x - a) + f(a)
[15]:
def derivative(a):
    h = 0.0000001
    return (f(a + h) - f(a))/h
[16]:
plt.plot(x, f(x))
plt.plot(1, f(1), 'o')
plt.plot(x, tan_line(x, 1), color = 'orange')
[16]:
[<matplotlib.lines.Line2D at 0x7fa810532bd0>]
[17]:
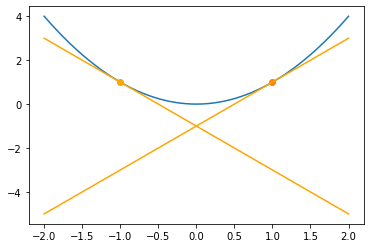
plt.plot(x, f(x))
plt.plot(1, f(1), 'o')
plt.plot(x, tan_line(x, 1), color = 'orange')
plt.plot(-1, f(-1), 'o', color = 'orange')
plt.plot(x, tan_line(x, -1), color = 'orange')
[17]:
[<matplotlib.lines.Line2D at 0x7fa810573a50>]
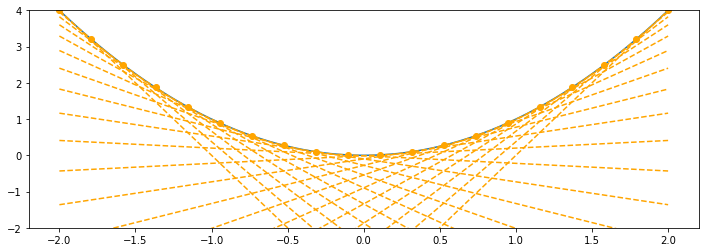
[18]:
plt.figure(figsize = (12, 4))
plt.plot(x, f(x))
for p in np.linspace(-2, 2, 20):
    plt.plot(p, f(p), 'o', color = 'orange')
    plt.plot(x, tan_line(x, p), '--', color = 'orange')
plt.ylim(-2, 4)
[18]:
(-2, 4)
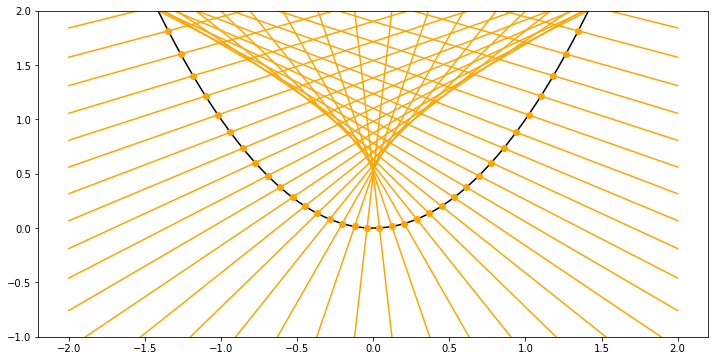
[19]:
def f(x):
    return x**2
plt.figure(figsize = (12, 6))
plt.plot(x, f(x), color = 'black')
for p in np.linspace(-2, 2, 50):
    plt.plot(p, f(p), 'o', color = 'orange')
    plt.plot(x, normal_line(x, p), color = 'orange')
plt.ylim(-1, 2)
[19]:
(-1, 2)
[20]:
from matplotlib.font_manager import FontProperties
[21]:
font = FontProperties()
[22]:
font.get_style()
[22]:
'normal'
[23]:
font.set_family('monospace')
[35]:
def normal_plotter(coef):
    def f(x):
        return coef*x**2

    def tan_line(x, a):
        return derivative(a)*(x - a) + f(a)

    def normal_line(x, a):
        return -1/derivative(a)*(x - a) + f(a)

    def derivative(a):
        h = 0.0000001
        return (f(a + h) - f(a))/h
    plt.figure(figsize = (12, 6))
    plt.plot(x, f(x), color = 'black')
    for p in np.linspace(-2, 2, 100):
        plt.plot(p, f(p), 'o', color = 'orange')
        plt.plot(x, normal_line(x, p), color = 'orange')
    plt.ylim(-3,3)
    plt.title('EVOLUTE', fontproperties = font, fontsize = 18)
    plt.setp(plt.gca(), frame_on=False, xticks=(), yticks=());
[36]:
interact(normal_plotter, coef = widgets.FloatSlider(0.1, min = -2, max = 2));