Problem Set I
You are to either write your completed solution in the solution cell if it is a text based question and code if it is a code question.
Question 1: Addition
- What kind of number will an even number plus an even number return; even or odd? Why?
- What is the sum of an even number and odd number? Explain.
Question 2: Multiplication
- What kind of number will an even number times an even number return? Explain.
- Odd times Odd?
- Even times Odd?
Question 3: Descartes
Read through the first 10 pages of Descartes Geometry here. Your goal is to first understand his visual approach to multiplication and square root extraction. Use his approach to demonstrate:
- Construction of \(3 \times 4\)
- Construction of \(\sqrt{7}\) (here is an extra visual for this)
Question 4: Babylonian Algorithm for Square Root
Read the Wikipedia entry on the Babylonian square root algorithm here. Why is it so that “if x is an overestimate to the square root of a non-negative real number S then \(\frac{S}{x}\) is an underestimate”? How do we use this to approximate \(\sqrt{2}\)?
Question 5: Functions with Python
Make sure you have reviewed the earlier videos. Use these and the example code below to answer the following questions.
- Represent the functions described in words below in symbols, tables, and plots using Python. For your tables, you will make a
DataFramewithPandas, for your symbolic representation you should use LaTeX in a text cell, and for your graph you should usematplotlib.
- Input a number and return its square.
- Domain for table is \(x \in [-2, -1, 0, 1, 2]\)
- Domain for plot is \(-5 \leq x \leq 5\)
- Input an angle and return the sin of the angle
- Domain for table is \(x \in [-\pi, -\pi/2, 0, \pi/2, \pi]\)
- Domain for plot is \(4\pi \leq x \leq 4\pi\)
- Input a number and return two to the power of that number
- Domain for table is \(x \in [-2, -1, 0, 1, 2]\)
- Domain for plot is \(-5 \leq x \leq 5\)
[1]:
%matplotlib inline
import matplotlib.pyplot as plt
import numpy as np
import pandas as pd
[8]:
#domain from -5 to 5 -- 1000 points
x = np.linspace(-5, 5, 1000)
[9]:
#define function f
def f(x):
    return x**2
[10]:
#evaluate f at x = 4
f(4)
[10]:
16
[13]:
#evaluate f at all x's in x
y = f(x)
[16]:
#table of values
f_table = pd.DataFrame({'x': x, 'f(x)': y})
[17]:
f_table.head()
[17]:
| x | f(x) | |
|---|---|---|
| 0 | -5.00000 | 25.000000 |
| 1 | -4.98999 | 24.900000 |
| 2 | -4.97998 | 24.800201 |
| 3 | -4.96997 | 24.700602 |
| 4 | -4.95996 | 24.601203 |
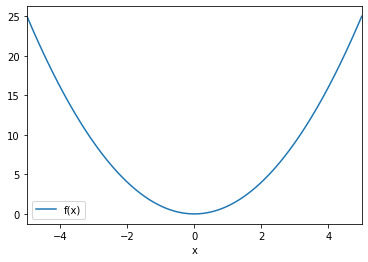
[20]:
#plot the function on domain x
f_table.plot('x', 'f(x)')
[20]:
<matplotlib.axes._subplots.AxesSubplot at 0x7fc3d8f1ab90>
[ ]:
[ ]:
[ ]:
[ ]:
[ ]:
[ ]:
[ ]:
[ ]:
[ ]:
[ ]:
[ ]:
[ ]:
[ ]:
[ ]:
[ ]:
[ ]:
[ ]: