[10]:
%matplotlib inline
import matplotlib.pyplot as plt
import numpy as np
import pandas as pd
from ipywidgets import interact
import ipywidgets as widgets
Functions and Summations
Warm Up:
Represent each of the following functions using symbols, tables, and graphs.
- Linear function with slope 7 and intercept of -2.
- Quadratic function including points:
| \(x\) | \(y\) |
|---|---|
| -2 | 0 |
| -1 | -1 |
| 0 | 0 |
| 1 | 1 |
- An exponential function whose terms increase as multiples of 3.
- A trigonometric function that passes through the point (0, 0) and completes 3 cycles by the time it reaches \(x = 3\pi\).
Functions and Summations
Repeat our operation above for the table shown below. After you’ve completed this, compute the values for the sum column. Can you determine a function to model this sequence?
| \(x\) | \(y\) | sum of first n terms |
|---|---|---|
| 1 | 1 | 1 |
| 2 | 2 | 3 |
| 3 | 3 | |
| 4 | 4 | |
| 5 | 5 |
[ ]:
[ ]:
[ ]:
[ ]:
Repat for the table given below.
| \(x\) | \(y\) | sum of first n terms |
|---|---|---|
| 1 | 1 | 1 |
| 2 | 8 | 9 |
| 3 | 27 | |
| 4 | 64 | |
| 5 | 125 |
[ ]:
[ ]:
[ ]:
[ ]:
[3]:
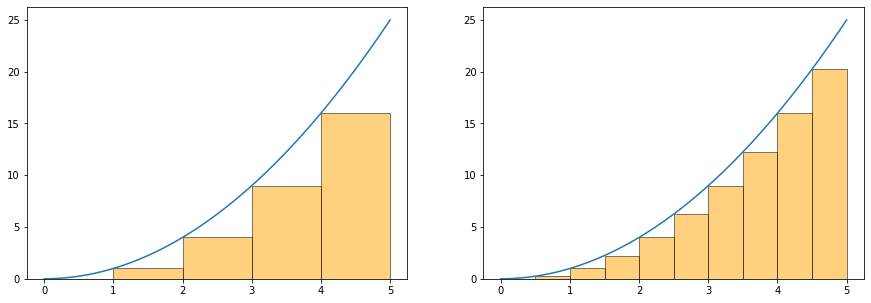
def f(x): return x**2
x = np.linspace(0, 5, 1000)

plt.figure(figsize = (15, 5))
plt.subplot(121)
plt.plot(x, f(x))
for i in range(5):
    plt.bar(i, f(i), width = 1, align = 'edge', color = 'orange', edgecolor = 'black', alpha = 0.5)

plt.subplot(122)
bases = [i for i in np.linspace(0, 5, 11)]
for b in bases[:-1]:
    plt.bar(b, f(b), width = 0.5, align = 'edge', color = 'orange', edgecolor = 'black', alpha = 0.5)
plt.plot(x, f(x),)
[3]:
[<matplotlib.lines.Line2D at 0x7fc4f043d950>]
[4]:
# !pip install gif
import gif
from IPython.display import Image
# def f(x): return x**2
# x = np.linspace(0, 10, 1000)
# @gif.frame
# def plot(i):
#     plt.plot(x, f(x), label = '$f(x)$', color = 'black')
#     for a in range(i +1):
#         plt.bar(a, f(a), width = 1, align = 'edge', color = 'orange', edgecolor = 'black')
[5]:
# frames = []
# for i in range(10):
#     frame = plot(i)
#     frames.append(frame)
[6]:
# gif.save(frames, 'images/rgif.gif', duration = 500)
[7]:
Image('images/rgif.gif')
[7]:
<IPython.core.display.Image object>
Riemann Sums
<img src = 'images/riemann.png' />
</center>
QUESTIONS
- Express \(x_0, x_1, x_2, x_3, x_4\) in terms of \(a\) and \(b\)
- Express the height of each rectangle in terms of the function \(f\)
- Multiply the width of each by its height and add these expressions together, call them \(R(4)\).
[ ]:
[ ]:
[ ]:
[ ]:
[ ]:
Problem
Consider the function \(f(x) = 4 - x^2\) on the interval \([-2,2]\).
- Draw a plot of the function
- Use your formula for \(R(4)\) to find an approximation for the area under the curve.
[ ]:
[ ]:
[ ]:
[ ]:
[ ]:
Taking it to the limit
What happens if we increase the number of rectangles?
[11]:
x = np.linspace(-2,2,100)
def f(x): return x**2
def riemann_slider(n):
    a = x[0]
    b = x[-1]
    width = (b-a)/n
    plt.plot(x, f(x), color = 'black')
    bases = np.array([a + width*i for i in range(n)])
    plt.bar(bases, f(bases), width = width, align = 'edge',
           color = 'orange', edgecolor = 'black')
    areas = [width * height for height in f(bases)]
    print(sum(areas))
[13]:
interact(riemann_slider, n = widgets.IntSlider(1, min = 1, max = 100, step = 2))
[13]:
<function __main__.riemann_slider(n)>
Example of \(f(x) = x^2\)
<img src = images/r2gif.gif />
</center>
Example of \(f(x) = \sin(x)\)

[15]:
# x = np.linspace(-4*np.pi, 4*np.pi, 1000)
# def f(x): return np.sin(x)

# @gif.frame
# def plot_riemann(n):
#     a = x[0]
#     b = x[-1]
#     width = (b-a)/n
#     plt.plot(x, f(x), color = 'black')
#     bases = np.array([a + width*i for i in range(n)])
#     plt.bar(bases, f(bases), width = width, align = 'edge',
#            color = 'orange', edgecolor = 'black')
#     areas = [width * height for height in f(bases)]
#     plt.title(f'Area: {sum(areas)}')

# frames = []
# for i in range(1, 100,10):
#     frame = plot_riemann(i)
#     frames.append(frame)

# gif.save(frames, 'images/r3gif.gif', duration = 200)
[16]:
# import gif
# from IPython.display import Image

# @gif.frame
# def plot_riemann(n):
#     a = x[0]
#     b = x[-1]
#     width = (b-a)/n
#     plt.plot(x, f(x), color = 'black')
#     bases = np.array([a + width*i for i in range(n)])
#     plt.bar(bases, f(bases), width = width, align = 'edge',
#            color = 'orange', edgecolor = 'black')
#     areas = [width * height for height in f(bases)]
#     plt.title(f'Area: {sum(areas)}')

# frames = []
# for i in range(1, 100,10):
#     frame = plot_riemann(i)
#     frames.append(frame)

# gif.save(frames, 'images/r2gif.gif', duration = 200)