Homework 2
OBJECTIVES
- Define four function types from class (linear, quadratic, exponential, trigonmetric)
- Represent functions using symbols, tables, words, and graphs
- Choose appropriate functions to model real world data
Problem I: Media Consumption
This assignment focuses on reviewing and extending our understanding of the idea of a mathematical function. Prior to completing the problems, I ask that you visit the results of the google search: “mathematical functions” and watch a youtube video or read a wikipedia page – consume some result of this search; maybe 10 - 20 minutes. Also, watch the video below. After doing this, write a few sentences about what you found and whether or not you felt the resource was helpful and why.
[1]:
from IPython.display import HTML

HTML('''
<center>
<h4>A Movie About Functions</h4>
<iframe src="https://player.vimeo.com/video/101690069?title=0&byline=0&portrait=0"
width="700" height="394" frameborder="0" webkitallowfullscreen mozallowfullscreen
allowfullscreen></iframe>
</center>
''')
[1]:
A Movie About Functions
Problem 2: Functions
Given the following symbolic representations of the functions and their domains, present a table and graph of the function.
- \(f(x) = x^3 - x^2 + x - 2; \text{on} ~ -10 \leq x \leq 10\)
- \(f(x) = 100(0.46)^x; \text{on} ~ 0 \leq x \leq 10\)
- \(f(x) = 2\sin(x^2); \text{on} ~ -\pi \leq x \leq 3\pi\)
[5]:
%matplotlib inline
import matplotlib.pyplot as plt
import numpy as np
import pandas as pd
[2]:
#answer 1 here
[3]:
#answer 2 here
[4]:
#answer 3 here
Problem 3: Data
For each of the problems below, you are given a table and graph of a real world dataset. You are asked to choose what kind of function you believe would be a good model of the data; linear, quadratic, exponential, or trigonometric.
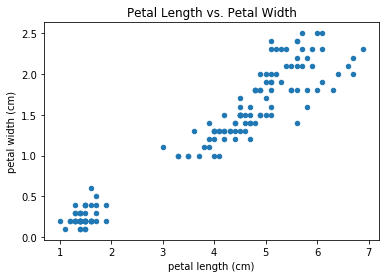
- The dataset below is on measurements of three different species of iris flowers. We have plotted the petal length on the horizontal axis and petal width on the vertical axis. What kind of function would be a more appropriate model for this data where we input a measure of a petal length, and output a width?
[48]:
from sklearn.datasets import load_boston, load_diabetes, load_iris
iris = load_iris()
iris = pd.DataFrame(iris.data, columns = iris.feature_names)
iris.head()
[48]:
| sepal length (cm) | sepal width (cm) | petal length (cm) | petal width (cm) | |
|---|---|---|---|---|
| 0 | 5.1 | 3.5 | 1.4 | 0.2 |
| 1 | 4.9 | 3.0 | 1.4 | 0.2 |
| 2 | 4.7 | 3.2 | 1.3 | 0.2 |
| 3 | 4.6 | 3.1 | 1.5 | 0.2 |
| 4 | 5.0 | 3.6 | 1.4 | 0.2 |
[60]:
iris.plot('petal length (cm)','petal width (cm)', kind = 'scatter', title = 'Petal Length vs. Petal Width')
[60]:
<matplotlib.axes._subplots.AxesSubplot at 0x7fac181c3550>
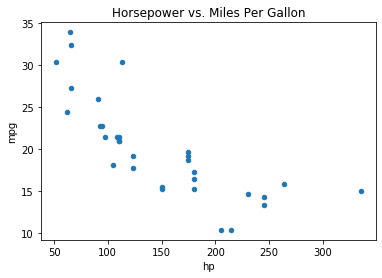
- The data below is from Motor Trend magazine and contains data on different models of cars from multiple manufacturers. We have plotted the measurements for horsepower on the horizontal axis and miles per gallon on the vertical axis. What kind of function do you think would be an appropriate model for this?
[73]:
cars = pd.read_csv('https://raw.githubusercontent.com/jfkoehler/calc_spring_2020/master/notebooks/data/mtcars.csv')
[17]:
cars.head()
[17]:
| Car | mpg | cyl | disp | hp | drat | wt | qsec | vs | am | gear | carb | |
|---|---|---|---|---|---|---|---|---|---|---|---|---|
| 0 | Mazda RX4 | 21.0 | 6 | 160.0 | 110 | 3.90 | 2.620 | 16.46 | 0 | 1 | 4 | 4 |
| 1 | Mazda RX4 Wag | 21.0 | 6 | 160.0 | 110 | 3.90 | 2.875 | 17.02 | 0 | 1 | 4 | 4 |
| 2 | Datsun 710 | 22.8 | 4 | 108.0 | 93 | 3.85 | 2.320 | 18.61 | 1 | 1 | 4 | 1 |
| 3 | Hornet 4 Drive | 21.4 | 6 | 258.0 | 110 | 3.08 | 3.215 | 19.44 | 1 | 0 | 3 | 1 |
| 4 | Hornet Sportabout | 18.7 | 8 | 360.0 | 175 | 3.15 | 3.440 | 17.02 | 0 | 0 | 3 | 2 |
[58]:
cars.plot('hp', 'mpg', kind = 'scatter', title = 'Horsepower vs. Miles Per Gallon')
[58]:
<matplotlib.axes._subplots.AxesSubplot at 0x7fac4597ac50>
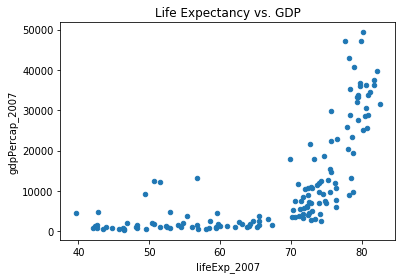
- The data below comes from the gapminder organization and contains data on countries GDP, Life Expectancy, and Population. We have plotted the data from life expectancy in 2007 on the horizontal axis and GDP on the vertical axis. What kind of relationship would be an appropriate model for this relationship?
[71]:
gapminder = pd.read_csv('https://raw.githubusercontent.com/jfkoehler/calc_spring_2020/master/notebooks/data/gapminder_all.csv')
[72]:
gapminder.head()
[72]:
| continent | country | gdpPercap_1952 | gdpPercap_1957 | gdpPercap_1962 | gdpPercap_1967 | gdpPercap_1972 | gdpPercap_1977 | gdpPercap_1982 | gdpPercap_1987 | ... | pop_1962 | pop_1967 | pop_1972 | pop_1977 | pop_1982 | pop_1987 | pop_1992 | pop_1997 | pop_2002 | pop_2007 | |
|---|---|---|---|---|---|---|---|---|---|---|---|---|---|---|---|---|---|---|---|---|---|
| 0 | Africa | Algeria | 2449.008185 | 3013.976023 | 2550.816880 | 3246.991771 | 4182.663766 | 4910.416756 | 5745.160213 | 5681.358539 | ... | 11000948.0 | 12760499.0 | 14760787.0 | 17152804.0 | 20033753.0 | 23254956.0 | 26298373.0 | 29072015.0 | 31287142 | 33333216 |
| 1 | Africa | Angola | 3520.610273 | 3827.940465 | 4269.276742 | 5522.776375 | 5473.288005 | 3008.647355 | 2756.953672 | 2430.208311 | ... | 4826015.0 | 5247469.0 | 5894858.0 | 6162675.0 | 7016384.0 | 7874230.0 | 8735988.0 | 9875024.0 | 10866106 | 12420476 |
| 2 | Africa | Benin | 1062.752200 | 959.601080 | 949.499064 | 1035.831411 | 1085.796879 | 1029.161251 | 1277.897616 | 1225.856010 | ... | 2151895.0 | 2427334.0 | 2761407.0 | 3168267.0 | 3641603.0 | 4243788.0 | 4981671.0 | 6066080.0 | 7026113 | 8078314 |
| 3 | Africa | Botswana | 851.241141 | 918.232535 | 983.653976 | 1214.709294 | 2263.611114 | 3214.857818 | 4551.142150 | 6205.883850 | ... | 512764.0 | 553541.0 | 619351.0 | 781472.0 | 970347.0 | 1151184.0 | 1342614.0 | 1536536.0 | 1630347 | 1639131 |
| 4 | Africa | Burkina Faso | 543.255241 | 617.183465 | 722.512021 | 794.826560 | 854.735976 | 743.387037 | 807.198586 | 912.063142 | ... | 4919632.0 | 5127935.0 | 5433886.0 | 5889574.0 | 6634596.0 | 7586551.0 | 8878303.0 | 10352843.0 | 12251209 | 14326203 |
5 rows × 38 columns
[57]:
gapminder.plot('lifeExp_2007', 'gdpPercap_2007', kind = 'scatter', title = 'Life Expectancy vs. GDP')
[57]:
<matplotlib.axes._subplots.AxesSubplot at 0x7fabd0024410>
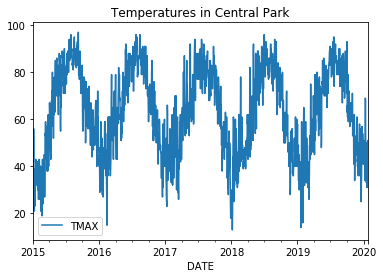
- The data below comes from the Central Park weather station for the maximum temperature on each day since 1870. We have plotted the most recent five years of the data where the date is on the horizontal axis and temperature on vertical. What kind of a function would be the right model for this data?
[69]:
temps = pd.read_csv('https://raw.githubusercontent.com/jfkoehler/calc_spring_2020/master/notebooks/data/2017018.csv', usecols=['DATE', 'TMAX'],
                    parse_dates = ['DATE'], index_col='DATE')
[70]:
temps.head()
[70]:
| TMAX | |
|---|---|
| DATE | |
| 1870-01-01 | 43 |
| 1870-01-02 | 54 |
| 1870-01-03 | 41 |
| 1870-01-04 | 35 |
| 1870-01-05 | 34 |
[56]:
temps['2015':].plot()
plt.title('Temperatures in Central Park')
[56]:
Text(0.5, 1.0, 'Temperatures in Central Park')
Using Models
For each of the questions below, you are given a model that your team of data scientists have developed based on a given dataset. You are asked three main questions:
- Evaluate model at given value.
- Compare model prediction to actual value.
- Discuss whether the model is a good model for the data and why or why not.
Problem 5: Iris Data
- Model: petal length = petal width \(\times\) .7 or \(f(x) = .7x\).
Use the example observation below to compare the offered model to the real data. How close was your prediction? Was this good or bad? Would you recommend this model for other data? Explain.
[62]:
iris.iloc[3]
[62]:
sepal length (cm)    4.6
sepal width (cm)     3.1
petal length (cm)    1.5
petal width (cm)     0.2
Name: 3, dtype: float64
Problem 6: Cars
- Model: mpg = hp/10 or \(f(x) = \frac{1}{10} x\) .
Same questions above using the test point below.
[66]:
cars.iloc[21]
[66]:
Car     Dodge Challenger
mpg                 15.5
cyl                    8
disp                 318
hp                   150
drat                2.76
wt                  3.52
qsec               16.87
vs                     0
am                     0
gear                   3
carb                   2
Name: 21, dtype: object
Problem 7: Textbook Problems
The questions below come from the OpenStax Calculus text. Feel free to review the chapters for additional examples of functions. Answer the questions below:
For the following problems, consider a restaurant owner who wants to sell T-shirts advertising his brand. He recalls that there is a fixed cost and variable cost, although he does not remember the values. He does know that the T-shirt printing company charges \(\$440\) for 20 shirts and $1000 for 100 shirts.
- Find the equation \(C = f(x)\) that describes the total cost as a function of number of shirts and b. determine how many shirts he must sell to break even if he sells the shirts for $10 each.
- Determine how many shirts the owner can buy if he has $8000 to spend.
For the following problems, consider the population of Ocean City, New Jersey, which is cyclical by season.
- The population can be modeled by
, where 𝑡 is time in months (𝑡=0 represents January 1) and 𝑃 is population (in thousands). During a year, in what intervals is the population less than 20,000? During what intervals is the population more than 140,000?
- In reality, the overall population is most likely increasing or decreasing throughout each year. Let’s reformulate the model as
, where 𝑡 is time in months ( 𝑡=0 represents January 1) and 𝑃 is population (in thousands). When is the first time the population reaches 200,000?
Problem 8: Twitter
Look over the following twitter post from Grant Sanderson (creator of the 3blue1brown youtube channel):
https://twitter.com/3blue1brown/status/1002248647172472832?lang=en .
What do you think the probability of getting between 490,000 and 510,000 heads is?
Read some of the responses to the post. Anything of interest?
Problem 9: The Triangle
<img src = https://wikimedia.org/api/rest_v1/media/math/render/svg/23050fcb53d6083d9e42043bebf2863fa9746043 />
</center>
- Can you find a pattern that is a linear pattern in the triangle?
- Can you find a quadratic pattern in the triangle?
- Add the values in the rows shown above. Is there a pattern here?